Archive for the ‘recovery’ Category

Working men are p***ed

29 July 2016

Unemployment at 4.9%. More than 75 straight months of continuous job growth. Per capita GDP at an all-time high. Summer’s here. But nobody’s dancing in the streets.

Here are a couple graphs that may help explain why:

FREDpersYpcapGDP

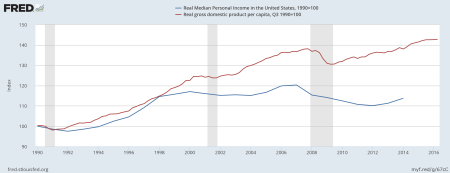
First, note that even as real per capita GDP continues to reach new peaks, the typical American adult (i.e., the person at the 50th percentile) in 2014 was no better off than in the last two recessions. Median personal income was down about 5% from about a decade ago. The rising tide is clearly not lifting all boats. The more politicians crow about the improving economy and the more economists say we are at “full employment,” the greater the disconnect becomes.

Caveat: Ideally I’d have median personal income data from after 2014. The numbers have likely improved since then. Jared Bernstein notes that real weekly earnings have grown almost 4% since 2014. Whether personal income has had similar growth also depends on employment trends. Which brings me to:

blsEP2554saMF

The above is the US “prime-age” (25-54) employment/population ratio from 1990 to present. The employment/population ratio is about 2 points lower now than then, partly because the standard unemployment rate is about 1 point higher and also because more jobless people are “out of the labor force,” i.e., not actively seeking work. Would they take work if offered it? The Bureau of Labor Statistics report for June suggests many of them would — the alternative unemployment rate including jobless “discouraged workers” and “persons marginally attached to the labor force” is 6.0%. (Add in part-time workers who’d prefer to be full-time and the rate rises to 9.6%. It’s been improving for six years but is still no better than in mid 2008 when we were in a recession.)

What’s really striking to me, and what inspired the title, is the gender breakdown of those prime-age employment/population numbers. (Sorry, the separate BLS graphs for men and women are too messy to use here, but you can Google them.) For women, the employment/population ratio has regained its 1990 level of 71%; for men, the ratio is down about 5 points, to 85%. There’s a story here, probably several. The erosion of male privilege has been a big theme of this year’s political commentary. Without getting into the politics or ethics of that, let’s just note:

  • These graphs indicate that it by no means a new thing, at least in the labor market. The male employment/population ratio has been falling since 1969, when it was 95%. The female employment ratio has been rising steadily since at least the late 1940s, when it was less than half the current level.
  • During the boom decade of the 1990s, the male employment/population ratio fell by about half a point, while the female ratio rose sharply, from 71% to 74.5%.
  • Male employment was hit harder than female employment during the 2008-2009 recession (men’s employment fell from 89% to 81%, women’s from 74.5% to 69%).
  • Men’s employment has actually risen faster than women’s during the post-2009 recovery (ratio up by about 4 points vs. 2 points), but again, the male employment ratio is down about 5 points from 1990, whereas the female employment ratio is unchanged.


How the US economy is like Luke Wilson in “Idiocracy”

10 March 2014

See for yourself. Our anemic economic performance since 2007 is . . . the best in the world?

Image

Yes, it’s still a slow recovery that has yet to restore full employment, but, except for Germany, we’ve done better than any of our counterparts in Europe that also experienced a financial crisis.

“The ordinary will be considered extraordinary.”

I was going to say something about the folly of austerity policies (spending cuts and tax increases) during an economic slump, which is true insofar as US budget policy has been only mildly contractionary while our European counterparts have embraced austerity and all but one have sick economies to show for it, but that one is Germany, which was slightly ahead of the US as of 2013:Q2 (data for 2013:Q3 and Q4 were not available for the European countries). Germany’s economy defies easy explanation. Maybe Germany should be Luke Wilson’s character and the US can be Maya Rudolph’s.

(For anyone who’s not familiar with “Idiocracy,” here’s the trailer.)

Butter before guns

30 January 2013

George F. Will once wrote, “All economic news is bad news. All economic news is good news.” Today’s GDP report has lots of both and has already sown a lot of confusion. Real GDP fell in the last three months of 2012, indicating a recession (although the drop was only 0.1%). Part of the decline came from reduced inventory investment, i.e., from companies not producing as many goods that haven’t been sold yet. So far, so bad.

The biggest decline came in government spending; in particular, military spending dropped a whopping 22%. Why? The Washington Post’s Brad Plumer says it has something to do with the drawdowns in Iraq and Afghanistan and apparently also with the various budget games that the Pentagon and other government agencies play, as regards the timing of the fiscal year and the “sequester” budget cuts that could come if Congress fails to raise the debt ceiling. One thing I learned from Plumer’s piece is that, although the 22% drop is unusually large, it’s not unusual for defense spending to drop in a particular quarter. It did so in about half of the twelve quarters from 2010 on; the second-largest drop was almost 15%.

Many people would view the big reduction in military spending as a good thing — the wars are unpopular, and some studies have found that, dollar for dollar, domestic government spending tends to create more jobs than does military spending. Aside from military spending, real GDP rose in the last quarter of 2012, by 1.3%.

Is 1.3% good? Of course not. It makes 2012:IV one of the weaker quarters of the past two years, in which the economy’s average annual growth was 2.0%. The economy grew at 3.1% in the third quarter of 2012, so this is a step backward at least in a relative sense.

But positives are not hard to find in the GDP report. Thus Bloomberg’s headline “Growth Stall Obscures Consumer, Business Pickup.”  Consumer spending grew at a decent 2.2% clip, up from 1.6% in the third quarter. Rising auto sales were a big part of the increase (which sounds about right to someone like me who bought a car for the first time since 1999). I would guess that some of the slippage in inventory production was simply due to consumers buying more goods than anticipated, with the result that inventories were down. (If inventory production had not fallen, then GDP would have grown by 2.6%, according to the Bloomberg article.) The best news of all was probably on the housing front, where residential construction (counted in the “Investment” part of GDP) grew by 15%. For 2012 as a whole, housing construction rose 12%, its biggest increase since 1992.

The markets seem to have to shrugged off the report. Market participants may doubt that the increased consumer spending and construction are sustainable. Right now, five hours after the release, the Dow, S&P 500, and Nasdaq averages are basically unchanged (within 0.05% of yesterday’s close).

Glimmer of light

16 August 2012
No, I haven’t suddenly turned into an economic optimist, but this week’s new retail sales report is even better news than the media have noted. What’s they’ve noted is that retail sales in July rose 0.8% relative to June, which was better than expected. They’ve also noted that retail sales fell 0.7% in June, which kind of cancels it out. But the bigger and better news, I think, is in the yearly change: retail sales rose 4.1% compared with July 2011, which is a pretty healthy rate of increase. And retail sales for the three-month period of May-July 2012 were 4.3% above the corresponding period for last year.

Two components that caught my eye:

  • Sales of sporting goods, hobby, book, and music stores rose 10.6%. Perhaps not a very large part of GDP, but notable in that these goods tend not to be necessities. The surge in spending on these goods may point to growing consumer confidence that the consumer-confidence surveys (which tend to be focused on big-ticket purchases) do not pick up.
  • Nonstore retailers’ sales rose 11.8%. I assume this mostly means online sales from places like Amazon.com. Double-edged sword: good for consumers and those companies, probably bad for job creation as a whole, as I’d expect companies like Amazon.com to be a lot less labor-intensive than traditional brick-and-mortar stores. Which may have something to do with why the U.S. economy has been so crap at job creation over the past dozen years.

I should note that these numbers are not adjusted for inflation, but even after the adjustment they are still decent, especially considering that the Eurozone is basically in recession (0% growth in 1st quarter, 0.2% decline in 2nd quarter). The consumer price index rose just 1.4% y/y (July 2011 – July 2012) and not at all in July 2012, so this is a real improvement. Has the American consumer awakened?

What’s dragging the economy down?

27 August 2011

This recent observation by Dean Baker got me thinking:

‘As noted in today’s lesson on accounting identities, the share of GDP devoted to investment in equipment and software is almost back to its pre-crisis level. And, the saving rate is still below its post-war average, meaning that consumption is high, not low.’

The point about investment is particularly notable. All through this Little Depression we’ve been hearing that companies are reluctant to invest, whether because of pessimism about future sales (me, for example) or because of uncertainty about future taxes and regulations (conservatives). A bit less than half of  investment is in equipment and software, so it’s good news that that’s largely come back. The larger part of investment, structural investment (both commercial and residential), is still hurting, however; I’d think the reasons are related to the post-2007 woes in the housing and real estate sector in general.

The Commerce Department’s quarterly GDP reports are a godsend for trying to pinpoint what areas of the economy are strong and which are week. The reports have three one-page tables: Table 1 gives the annualized real percent change for the various GDP components, broken down into a couple dozen sub-components; Table 2 gives the contribution of each one to real GDP growth (e.g., if increased investment caused GDP growth to be 1.0% instead of 0.0%, its contribution is listed as 1.0%); Table 3 gives the dollar value of each component and sub-component. Yesterday’s report contains revised figures for the second quarter of this year, and quarterly figures dating back to 2007. What do they tell us?

First, looking at the yearly figures, in 2008 and 2009, the two years when real GDP actually fell, investment fell even more sharply, and consumption fell somewhat, with positive contributions from net exports and (secondarily) government purchases making up some of the difference. Okay, that’s not news, but it’s worth keeping in mind.

Turning to the quarterly figures, we’ve now had two full years of rising real GDP dating back to the third quarter of 2009, but from 2010:I to 2011:I that growth slowed in every single quarter: 3.9, 3.8, 2.5, 2.3, 0.4%. It rebounded to a still-anemic 1.0% in 2011:II. Those last few growth rates are not enough to keep the unemployment rate from rising, which is the definition of a “growth recession.”

The economy had three consecutive strong quarters in 2010:IV-2011:II, with real GDP growth of almost 4%. What drove that little spurt? In the first two cases, investment, especially inventory investment (which means companies were optimistically producing in expectation of higher sales and/or failed to sell much of what they produced). Equipment and software investment made a modest contribution, and structural investment again made a negative contribution. In the third quarter, investment again led the way (this time sparked by equipment and software), with consumption closely behind. Notably, despite the federal stimulus, the total government contribution to GDP growth was slightly negative in those first two quarters (state and local retrenchment more than offset the federal stimulus) and modest in the third quarter (of note: the modest federal contribution of 0.71% was actually the second-highest since the stimulus began, with the highest being 1.09% in 2009:II. Draw your own conclusion. Mine is that the stimulus was way too small.)

What caused growth to be so slow in the first two quarters of 2011? Government retrenchment led the way, with respective contributions of -1.23% and -0.18%. In the first quarter, most of the retrenchment was at the federal level (-0.81%), which probably represents the winding down of the stimulus. In the second quarter, state and local government retrenchment shaved 0.34% off GDP, while the federal contribution was slightly positive. Also in the first quarter, a surge in imports mostly negated the contribution of increased consumption (1.47%-1.35%).

If we want to look for positives, here are the components of real GDP that grew by at least 3% (annualized, and 3% is about the historic norm for GDP growth) in both quarters of 2011:

  • investment in equipment and structures: 8.7%, 7.9%
  • exports: 7.9%, 3.1%

Not bad, but too small in relation to the economy to lead economic growth. Investment in structures was still poor (with a combined contribution to GDP growth in the two quarters of about zero), and rising imports more than offset the improvement in exports. Perhaps the key thing that sticks out is that even without the drags on the economy from government retrenchment and negative net exports, the positive parts of the economy were themselves fairly weak. Consumption contributed just 1.47% and 0.30% respectively; investment just 0.47% and 0.78%. Even without the drags from government and net exports, that’s total growth of just 1.94% and 1.08%. This is still a very slowly recovering economy, still a Little Depression. It also looks like there’s way too much vacant housing and physical plant out there for many people to want to build.

If we make it through December

3 December 2010

The BLS unemployment report for November is out, and it ain’t pretty.  Less than a third as much job creation (+39,000) as expected, not nearly enough to absorb new entrants into the labor force, so the official unemployment rate edged up to 9.8%.  (The comprehensive U-6 unemployment rate was unchanged at 17.0%.)

The private sector added 50,000 more jobs, and the government shed 11,000 jobs.  It is a bit hard to disentangle private sector jobs from the government, in view of the fact that the $787 billion stimulus went mostly to the private sector as opposed to new government jobs, but it is rather remarkable how little the government is doing in terms of direct job creation.  At the federal level this comes down to politics — in this conservative age, creating 3.5 million temporary government jobs, as the New Deal did each year, is considered a bad thing.  Indirectly creating or saving 3.5 million jobs, as the Obama Administration credits the stimulus with having done, is politically viable (or was in early 2009) but hard to prove, which is probably why the stimulus is unpopular with most of the public.  At the state and local level, of course, it comes down to balanced-budget requirements — with tax revenues down for the count, everyone’s cutting government payrolls to try to close the budget gap.  (Without emergency federal aid to make up the difference, the recession gets magnified at the state and local government level.)   If I eyeballed the numbers correctly, employment is down for the year at all three levels of government.

The only good news I noticed in the report was that the number of temp workers, a leading economic indicator of employment, increased for the fourth straight month.  (And even then, the increase is smaller than in several months earlier this year.)  Another leading indicator, weekly hours worked, did not improve, instead holding steady at 34.3 hours.

Now, the unemployment rate is a lagging indicator, and there are positive signs of recovery elsewhere, but that’s cold comfort to the nation’s 15 million unemployed. Seems like we’re back to where Merle Haggard  was in 1973, especially with Republicans in Congress so far refusing to extend unemployment benefits for the long-term jobless:

Autarchy in the US

23 November 2010

(No, this is not a call for protectionism.)

The third-quarter GDP growth numbers are better than originally reported, as today the Commerce Department revised them from their 2.0% initial estimate up to 2.5%.  As many commentators have no doubt noted, that’s still short of the 3.0% thought to be necessary to reduce the unemployment rates.  But we should not stop there.  The more I look at the quarterly GDP figures, especially in the Commerce Department’s full report, which includes a table that breaks down the contribution to percent change in real GDP from each of the main components, i.e., consumption, business investment, government purchases, and net exports, the more it looks like a real recovery is underway.

Looking over those GDP breakdowns over time, a couple patterns emerge.  First, as is often noted, fluctuations in business investment tend to be the key to recessions and recoveries.  Investment is highly volatile, more so than consumption, and it tends to lead the business cycle.  Second, net exports are even more volatile and, unlike investment, don’t have much of a cyclical pattern. They seem to be mildly countercyclical (in a recession that hits the whole world evenly, our imports would fall more than our exports would, simply because we our imports are much larger than our exports to begin with), but whatever cyclical pattern exists seems to be swamped by other fluctuations: just eyeballing the numbers, the GDP contribution of net exports looks like one of those “random walks.”  Consider net exports’ percent contribution to real GDP over the past five quarters (i.e., since recovery officially began, or 2009:III-2010:III):

-1.37 1.90 -0.31 -3.50 -1.76

Not much of a trend there –close to -1.5% in the first quarter of the recovery, sharply positive in the second, near zero in the third, huge and negative in the fourth, back around -1.5% in the fifth.  These big fluctuations can drive the quarterly real GDP changes, masking what’s happening in the domestic economy.  Officially, real GDP over the past five quarters grew by the following amounts (seasonally adjusted at an annual rate:)

1.6 5.0 3.7 1.7 2.5

Again a lot of fluctuation, with the strongest readings coming the two times when net exports’ contribution was either positive or near zero. If we omit net exports to get a closer look at actual domestic spending (i.e., C+I+G, or “domestic absorption,” as development economists call it), the growth of the rest of real GDP over the same span looks like this:

3.0 3.1
4.0 5.2 4.3

A much clearer picture:  GDP grew slowly in the first two quarters of the recovery, and thereafter at a much faster clip, about 4%-5%.  It looks to me like the domestic U.S. economy has been recovering a respectable pace in 2010.  While net exports may continue to be a drag on the economy in the future, especially as our European trading partners opt for the bloodletting approach to their economies, their extreme fluctuation makes me leery of making a definite prediction about net exports. I feel safer in saying that consumption and investment seem to be leading the U.S. recovery and that investment will hopefully pick up further as more businesses come to believe that a genuine recovery is underway.

Green shoots and leaves

18 November 2010

The Conference Board’s index of leading economic indicators is up again, by 0.5%, for each of the last two months.  This is very good news, yet it was hardly reported at all.

That wasn’t all of today’s good news, either.  Jobless claims (i.e., unemployment insurance claims) were at about the same level as last week’s two-year low.  And the Philadelphia Federal Reserve district, which had been very weak, showed astounding improvement in today’s report, with its general business conditions index jumping from near-zero to 22.5, way ahead of the consensus forecast range of 4.o to 9.6.  Bloomberg summed up the Philly Fed news as follows:

“Philly Fed data have been lagging regional and national data but not in November. The report’s November index on general business conditions jumped from a zero-flat trend to a prodigious 22.5 to indicate very sharp month-to-month growth. New orders rose more than 15 points to 10.4. Shipments also rose more than 15 points, to 16.8. The region’s manufacturers are showing commitment by adding to their workforces as the jobs index rose more than 10 points to 13.3. . .

“This report points to accelerating strength for what is already solid growth for the national manufacturing sector. Interestingly, these results contrast with Monday’s weak Empire State report from the New York Fed, a report that had been significantly stronger than Philly’s. Month-to-month swings in regional data shouldn’t cloud what is generally a positive outlook and continued leadership for the nation’s manufacturing sector.”

A genuine recovery really does seem to be underway.  It’s still not nearly fast enough, but the pace could easily pick up, and these indicators suggest it will.  I have other reasons for my current optimism, but I’ll get to those later.