Posts Tagged ‘bls employment report’

Declare victory and taper?

19 December 2013

Wednesday the Federal Open Market Committee did the expected, by announcing a “tapering” off of its $85 billion monthly purchases of long-term Treasury bonds and mortgage-backed securities (MBS’s), citing “the cumulative progress toward maximum employment.” Thursday the BLS announced that weekly jobless claims rose to their highest level in nine months. Ouch.

Granted, the spike in jobless claims might not mean much, as they can be volatile, especially around holiday time, and indeed the four-week average of jobless claims “only” rose to its highest level in one month. Even so, the “progress toward maximum employment” has been glacial, if it can be called progress at all. The media have trumpeted the good news in the Bureau of Labor Statistics’ (BLS) latest employment report, which found that the standard unemployment rate fell from 7.3% to 7.0%, its lowest level in five years, and employers added 203,000 jobs. That’s fine, but it’s also just one month. Let’s look at the past year, from Nov 2012 to Nov 2013, using the Households Survey numbers in the employment report.

In the past year the adult US population grew by almost 2.4 million. The number of people “Not in labor force” (neither employed nor actively looking for a job) also grew by slightly more than 2.4 million. The total US labor force actually fell by 25,000, and the employment-to-population ratio also fell slightly, from 58.7% to 58.6%. While it’s good news that total employment rose by 1.1 million and unemployment (and people who say they currently want a job) fell by 1.1. million, the biggest growth sector by far is “Not in labor force,” again with 2.4 million. The employment/population ratio is exactly the same now as it was four years ago, in Nov 2009. This is not progress.

I wouldn’t be an economist if I never said “On the other hand,” however, and on that hand we have the “Establishments Survey” that furnishes the other half of the BLS report. The unemployment and employment/population rates come from the Households Survey; the payroll numbers (e.g., 203,000 jobs added) come from the Establishments Survey. Average monthly payroll growth for the past year was 191,000 jobs, or more than double the puny job growth in the Households Survey (1.1 million / 12 months = 92,000 jobs per month).

What would victory look like on the jobs front? I would say 5% unemployment, which the economy had for 35 straight months in the mid-2000s, or less. (And I would want the reduction to come from job growth and not from people leaving the labor force.) How far are we from 5% unemployment? The Atlanta Fed’s handy jobs calculator has the answer. If the economy keeps on adding 191,000 jobs per month, we return to 5% unemployment in three years. If it adds just 92,000 jobs per month, we never get back to 5% unemployment, unless the labor force does a whole lot of shrinking. If we split the difference and figure the correct figure is right in the middle at 141,500, then we get there in seven and a half years, in early 2021.

Back to the taper. The labor data suggest a need for more, not less, monetary stimulus, but how much stimulus were those emergency bond-buying programs providing? All we know is that they created $85 billion in new bank reserves each month. For the programs to work, banks needed to loan out those reserves. Not much of that has been happening:

Image


Real estate and consumer loans are flat. Business loans are rising but not fast enough to return to their trend level. (Which, by the way, is true of just about every other macro aggregate — household consumption, business investment, etc.) Just as the fastest-growing occupational category is Not In Labor Force (NILF?), the most dramatic growth on bank balance sheets is excess reserves:

Image

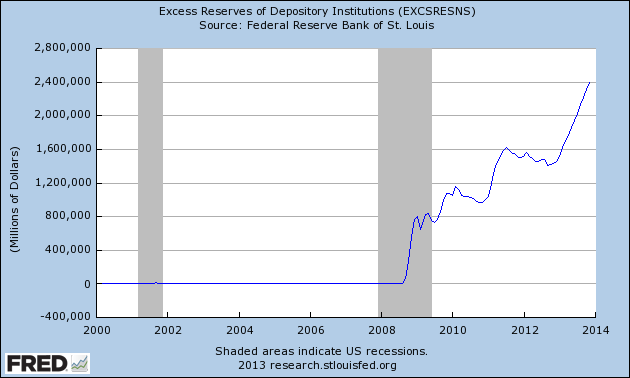
This is what pushing on a string looks like. Maybe the taper is causing the volume of loans, however meager, to be larger than it otherwise would be, but it’s hard to believe it’s making a world of difference. An oft-cited study published by the Brookings Institution found that the MBS purchases had managed to lower mortgage rates but that the Treasury bond purchases had not lowered long-term Treasury rates. And lowering long-term interest rates, as the bond buying is supposed to do, is only part of the game. Banks have to make loans at those rates. As we saw in the first graph, not nearly enough of that is happening. And the economy probably has to improve a lot more before banks are eager to lend and people are eager to borrow. Catch-22, yes.

All in all, the slight taper, from $85 billion to $75 billion a month, is unlikely to do noticeable harm, since the bond-buying program doesn’t seem to be making a big difference in the first place. Declaring victory, or even declaring substantial progress, on the employment front is foolish, but tapering is another story. Alternative policies, like ending the payment of interest (currently 0.25%) on bank reserves, might be preferable to the long-term bond-buying, but it’s clear from the last few years that Fed cannot be the main driver on the road to recovery. Congress could, through fiscal policy, but won’t, preferring austerity to stimulus, when it isn’t shutting down the government entirely. It looks like we’ll have to cross our fingers and hope for the “natural forces of recovery” to work their magic.


7.4%: Good news you can’t use

4 August 2013

Another first Friday, another BLS employment report, and the headline news is pretty good: In July the official unemployment rate fell to its lowest level, 7.4%, since 2008. If you were a White House publicist that morning, you could have noted that fact and also that the comprehensive U-6 unemployment rate (which includes discouraged job-seekers and involuntary part-timers) also fell, from 14.3% to 14.0%. And then you could have taken the rest of the day off.

The improvement in the U-6 unemployment rate was not enough to cancel out the previous month’s 0.5% point jump. The U-6 rate was below 14% in March, April, and May. The improvement in the official (U-3) rate was exactly counterbalanced by an 0.1% point drop in the labor force participation rate (to 63.4%). The employment/population ratio was unchanged (at 58.7% for all adults, and 75.9% for prime-age (25-54) year-old adults). The decline in participation defies easy explanation, as it involves three distinct subgroups — adult white males, white teenagers, and adult black females — but not others. (A notable recent trend, by the way, is for fewer people, especially young women, to not enter the work force.)

The unemployment rates come from the BLS’s survey of households. The BLS’s other survey, of employers (the “payroll survey”), is disappointing relative to the previous month’s. June’s report showed the economy with net job growth of 195,000, plus upward revisions of 70,000 jobs to the previous two months. July’s report has net job growth of 162,000, and downward revisions of 26,000 to the previous two months. At this month’s pace, it would take us a year longer to get back to 6% unemployment than at last month’s pace (using the handy Jobs Calculator of the Atlanta Fed).

The stock and bond markets seem to have gotten this report about right. The stock market barely budged, and the 10-year Treasury bond rate actually fell somewhat, from 2.72% to 2.60%, despite the improvement in the official unemployment rate. Both markets watch the employment reports with an eye toward the Fed’s next move on interest rates and “quantitative easing” (“QE”; special purchases of long-term bonds and mortgage-backed securities), all the more so after the Fed recently announced that it would start “tapering” off QE when unemployment falls to about 7.0% and start raising its key interest rate when unemployment falls to about 6.5%. While we’re a notch closer to those rates now, the trend does not look good. Treading water is about all this labor market is doing, and the markets seem to get that.

Glad tidings?

8 December 2012

The US unemployment rate fell to a four-year low of 7.7% in November, it was reported yesterday. The BLS (Bureau of Labor Statistics) report also noted that the economy added 146,000* jobs in November, a better figure than expected, considering Hurricane Sandy. Yet the report did not get a particularly warm reception. Analysts and cynics instantly threw cold water on these seemingly good numbers by stating that the unemployment rate fell only (or largely) because masses of unemployed people stopped looking for work in November and therefore were no longer counted as unemployed. Were they right? Off to the report’s detailed tables!

First, the non-detailed tables. Table A suggests that more than 100% of the drop in the unemployment rate came from people leaving the labor force, which could mean unemployed people giving up looking and no longer being counted as unemployed or in the labor force. The unemployment rate and labor force participation rates both fell by two-tenths of a percentage point, unemployment from 7.9 to 7.7% and labor force participation from 63.8 to 63.6%. The number of employed fell by 122,000*; the number of unemployed fell almost twice as much (229,000); and “not in labor force” rose by 542,000. So it would seem that a lot of people stopped looking.

(*That’s right — the same report that says the net change in jobs in November was +146,000 also says it was -122,000. The reason is that the BLS conducts two different surveys, one of employers (the “establishment survey” of payrolls), which had the positive figure, and one of households, which had the negative one. Barry Ritholtz had a nice cranky comparison of the two a few years back that’s still worth a look. Unfortunately, even though many economists regard the employer survey as more reliable, it tells us only about things like employment, hours, and wages, not about the people in or out of the labor force. For that we still need the household survey. Back to it.)

(more…)

As good as it gets, and still lousy

7 October 2011

The best that can be said about today’s BLS employment report is that it revealed 202,000 new jobs, which is in the right ballpark for how many jobs the economy needs to generate each month for the next eight years in order to get back to a normal unemployment rate. The bad news is that only 103,000 of those jobs are from last month. The other 99,000 are from revisions to July and August, which push those months’ net-new-jobs totals up to 127,000 and 57,000. So the average employment gain for the last three months is less than half of what we need to be on that eight-year recovery track.

It gets worse. Quoth the BLS: “Since April, payroll employment has increased by an average of 72,000 per month, compared with an average of 161,000 for the prior 7 months.” So now we’re down to about one-third of the needed monthly job creation to be on that eight-year recovery track.

NPR’s Planet Money reports that the job market is bad across all demographic groups, even the college educated. While college-educated people age 25 and over are the only group with an unemployment rate below 5%, the BLS historical tables show that the current rate (4.2%) is more than double what it was four years ago (2.0%). And the employment-to-population ratio of this group has fallen almost 3 percentage points (to 73.0%) over the same span.

The employment-to-population ratio is really where the worst news is. Even the expanded unemployment rates, which include discouraged job-seekers and/or involuntary part-timers, have shown some improvement over the past two years. But the improved unemployment rates seem to be entirely an artifact of people dropping out of the labor force. The labor force is actually slightly smaller today (154 million) than it was in mid-2009, at the trough of the recession. The economy has added about 1.6 million jobs since the employment trough of October 2009, but that hasn’t been been enough to keep pace with population. The current employment-to-population ratio (58.3%) is actually slightly lower than that of October 2009 (58.5%), even as the main unemployment rate has fallen from 10.1% to 9.1%.

Along those lines, the BLS’s “Alternate Measures of Labor Underutilization” are instructive. The official (U-3) unemployment rate counts only the jobless who say they are actually looking for a job. The U-4 unemployment rate includes “discouraged workers,” i.e., jobless people who are not looking but would take a job if one came along. The U-5 unemployment rate adds in “marginally attached workers,” who are a similar state of joblessness. Yet the U-5 unemployment rate (10.5%) is only 1.4 percentage points higher than the official rate, which suggests that most of the unemployed are either (1) still looking for work or (2) really not even thinking about it, i.e., have found life, or despair, or something,  outside the labor force.

The oft-cited U-6 unemployment rate, which is by far the highest, includes part-time workers who cannot get full-time work. This one is 16.5%, so most of the addition comes from the involuntary part-timers. So 6.0% of the labor force is involuntarily working part time. How does 6% compare with other times? The BLS data here go back only to 1994, so it’s hard to be definitive, but about 3% seems to be the norm. That’s what it was for most of 1994-2007, including even the recession and slow recovery of 2001-2003. That’s right — the involuntary-part-time employment rate is double what it was in the last recession and “jobless recovery.” It edged up to 4% in 2008, above 5% in 2009, reached 6% in September 2010 and has hovered around there ever since. That’s a lot of involuntary part-time jobs, and it adds another dimension of lousiness to the current depression. Also, if those are the kind of jobs this economy is creating, it’s no wonder that many people would rather hold onto their unemployment benefits, which, depending on their previous jobs, might pay more. But that’s a subject for another post.

Is inflation on target? (corrected)

5 August 2011

The new BLS unemployment numbers (9.1% unemployment rate, 16.1% comprehensive unemployment rate, 117,000 new jobs created) are the talk of the morning. I don’t have much to add to it, but I’ll echo the oft-made point that job growth needs to be twice as fast for the next several years for unemployment to fall to normal levels. I’ll also note that the numbers are a bit better than those of a year ago, but a bit worse than those of March, when unemployment was 8.8%. So although the numbers are better than expected, they’re still underwhelming and we still might be in a double-dip recession.

Instead I want to focus on the other big economic variable. Inflation has been so low over the past few years — in the range of 1-2% — that Ben Bernanke and others have seemed more worried about deflation than inflation. At the same time, some Fed critics have charged that the Fed’s actions to backstop dodgy financial asset markets and flood the banks with new reserves will lead to a massive inflation after the slump is over or a stagflation (stagnant economy with high inflation) even sooner. Some numbers to remember: Inflation has averaged 3% a year over the past century, and close to that over the past few decades. The Fed’s unofficial target for inflation is 2%. What do the markets expect for the years to come?

A good way to answer that question is to compare the well-reported interest rates on regular Treasury bonds with the interest rates on “TIPS” — Treasury Inflation-Protected Securities. The payments on a TIPS bond are adjusted for whatever inflation occurs over the bond’s lifespan.  The inflation adjustment is trickier than I’d originally thought — instead of simply adding the inflation rate to the interest rate that arose from the bond’s auction, the interest rate stays the same but the bond’s principal rises, and the interest payments are based on the original interest rate times the new principal. (Ex.: Imagine a 1-year, $1000-face-value TIPS bond that sells at par, i.e., for $1000 and therefore has an interest rate of 0%. If inflation is 3% over the next year, then the principal rises 3% to $1030. The interest is still $0, but the overall yield on the bond is 3% ($30/$1000). That’s a simplified example. It’s more complicated if the interest rate isn’t 0%.) Because the arithmetic can get complicated, it’s easier to look up the “breakeven” rate, which is the inflation rate implied by the different on TIPS and ordinary T-bonds.

(Add to that a conceptual complication: Because the TIPS bond is less risky, since it’s indexed for inflation, it should be in somewhat greater demand than the regular T-bond. So, other things equal, it should command a higher price and pay a lower interest rate. With that in mind, the difference between the interest rates on regular T-bonds and TIPS bonds is roughly the expected inflation rate plus an inflation-risk premium, which reflects people’s uncertainty about future inflation.)

Comparing the interest rates for 5-year bonds last week (when this was originally posted), the  T-bonds paid 1.12% and the TIPS paid -0.67%. The implied inflation rate (1.80%, if my spreadsheet math is correct) is actually very close to the difference in the interest rates on the two bonds (1.79%). Apparently the market is expecting the Fed to be just shy of its 2% target over the next 5 years.

Looking at the 10-year bonds, the T-bonds paid 2.47% and the TIPS paid 0.24%. The 2.03-percentage-point difference is again a close approximation of the breakeven rate; my spreadsheet math yields an expected inflation rate of 2.22%, or slightly over the Fed’s target. Together the two breakeven rates imply that the market is expecting inflation to average about 2.6% in years 6 through 10. These numbers provide no guide to where they think that inflation is going to come from (recovery? shortages of gas or food? QE5?), but the weakness in the stock market suggests they’re not expecting a recovery anytime soon. It may just be that their flight to safety has gone into overdrive, and TIPS are in exceptionally heavy demand because they are even less risky than regular T-bonds. So possibly they’re expecting inflation rates of about 1% through 2016 and 2% in 2016-2021, with the remainder being a risk premium.

In sum, the Fed does seem to be hitting its inflation target, more or less, but that’s about all. Bondholders appear willing to lock in near-zero or negative real returns over the next five or ten years, just so they can hold a safe asset. Which suggests they’re scared shitless.

Keep on working

8 November 2010

Some thoughts on last Friday’s BLS employment report, otherwise known as “the good one”:

The employment report is pretty good news indeed, especially as regards job creation in the private sector.  151,000 jobs were created overall (in the private and government sectors combined), about twice as many as market analysts had projected.  The increases in the length of the workweek and in overtime hours are also welcome news, as these are considered leading economic indicators.  (This is because companies often cut the hours of their workers during a recession and extend the hours of their workers in the early stages of a recovery rather than take on the overhead costs of hiring new workers.  As the recovery gains steam, they’ll actually hire new workers.)

Alas, the increase in employment, though much larger than expected, is still not large enough to reduce the unemployment rate, still at 9.6%.  The increase in employment was offset by new entrants into the labor force, not all of whom found work. All of this happened without any big changes in the labor force participation rate or the more comprehensive U-6 unemployment rate, which is still around 17%.

The increase in weekly paychecks is particularly good news, as Chris Isidore of CNN/Money notes.  Isidore points out that the increase comes not so much from higher hourly wages as from longer workweeks.  He mentions that 318,000 fewer workers are involuntarily working part-time instead of full-time jobs, compared with last month, and that is a big positive deal for a lot of people.

However, the increase in average weekly hours is not all that big; 318,000 is not that big a number compared with total employment (131 million).  The 1.8% month-to-month increase in average weekly hours was the largest in 26 years, as Isidore notes, but that too is less of a big deal than it might seem.  It’s an increase from 33.7 hours to 34.3 hours.  If you’re rounding to whole numbers, as I like to do to keep things less “statsy,” you’d miss the increase entirely.

A number worth trumpeting, as Isidore does, is the 3.5% year-to-year increase in average weekly wages, from September 2009 to September 2010. That’s especially good considering that inflation over the same span was about 1%, which means a 2.5% increase in real weekly wages.  A real wage increase of that magnitude was normal once upon a time (1947-72 and the second half of the 1990s), but for most of the past 40 years real wages have grown very slowly or hardly at all.  We’ll take it.